Infographic Poster: Hometown Exploration
Goal: Create an infographic poster that tells a story about your hometown. Explore storytelling through data visualization, and use layout design principles and information architecture to create a visually appealing poster.
Tools
InDesign, Illustrator
Year
2023
Course
Visualizing Information

In this project, we were tasked with creating an infographic poster that tells a story about our hometown. This project challenged me to explore storytelling through data visualization, and create a compelling poster that tells that story using layout design and information architecture. My hometown is Winnipeg, and in my poster I chose to explore, explain, and debunk some of the common stereotypes or misconceptions about the city.
Design Process

Planning & Research
Poster Design Process
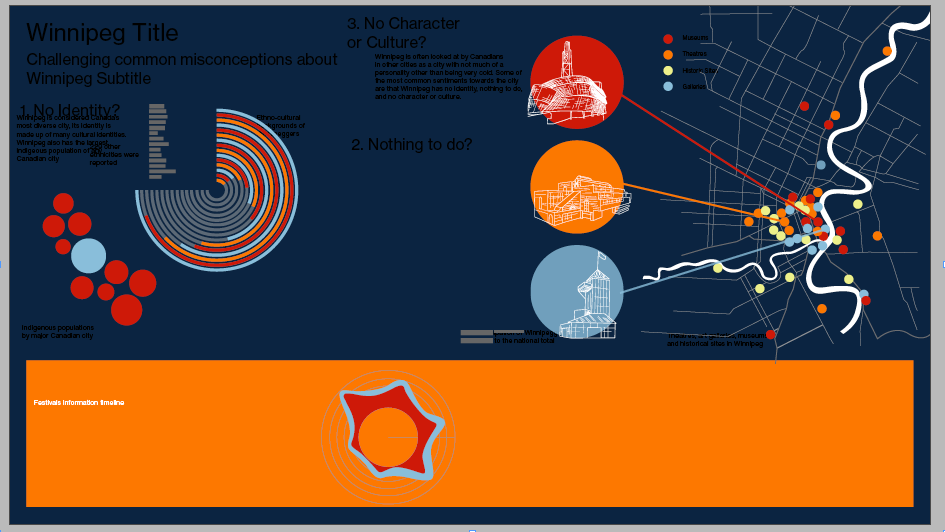
Low Fidelity Prototype
With most of my infographics drafted and an idea of how I wanted to lay out my story, I developed a low fidelity first draft that was shown to my peers for feedback. At this stage I was still very early in the process of deciding the layout and visuals for my poster, but had most of the research and graphs developed.

The first step for this project was to decide on the story that I wanted my poster to tell. Once I had decided to address common misconceptions, I started researching and collecting data I could use in my poster.
Each data set I found or collected would become an infographic for the poster design. I ended up with five data sets that became five unique infographics. These were put together in the final poster to tell my story.
I designed all of the infographics in Illustrator. To the right are the draft versions of the infographics/graphs before they were placed into the final poster.
With a combination of feedback from my peers and my own remaining list of “to-dos”, I was able to move on to the next stage of designing my final poster.

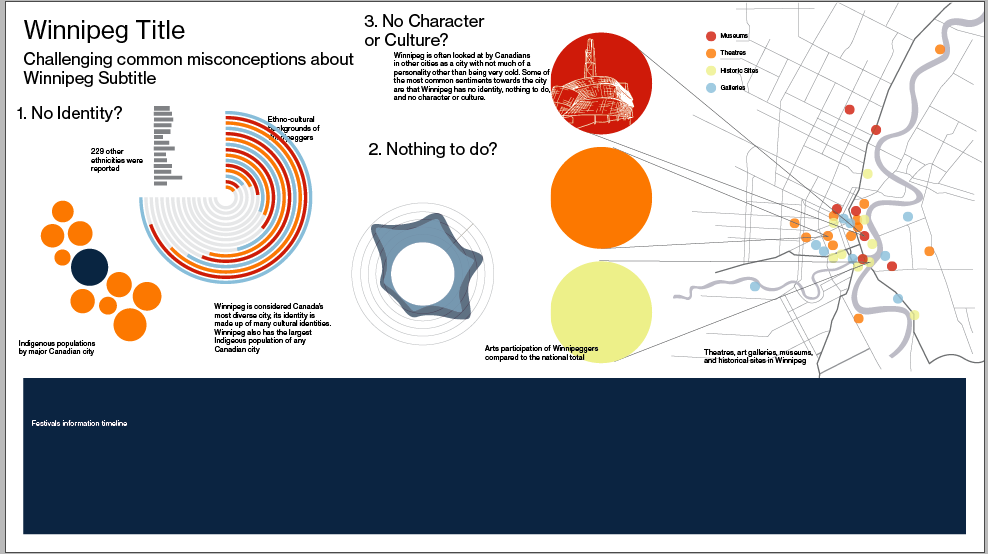
1. Implemented some of the feedback given on the initial prototype, further developed map graphic including illustrated callouts, and defined colour scheme

3. Defined typography, title, and subtitle. Finalized infographic/graph placement and colour use. Simplified map graphic and integrated it into timeline graphic.

2. Continued to work on map graphic, further defining colour placement
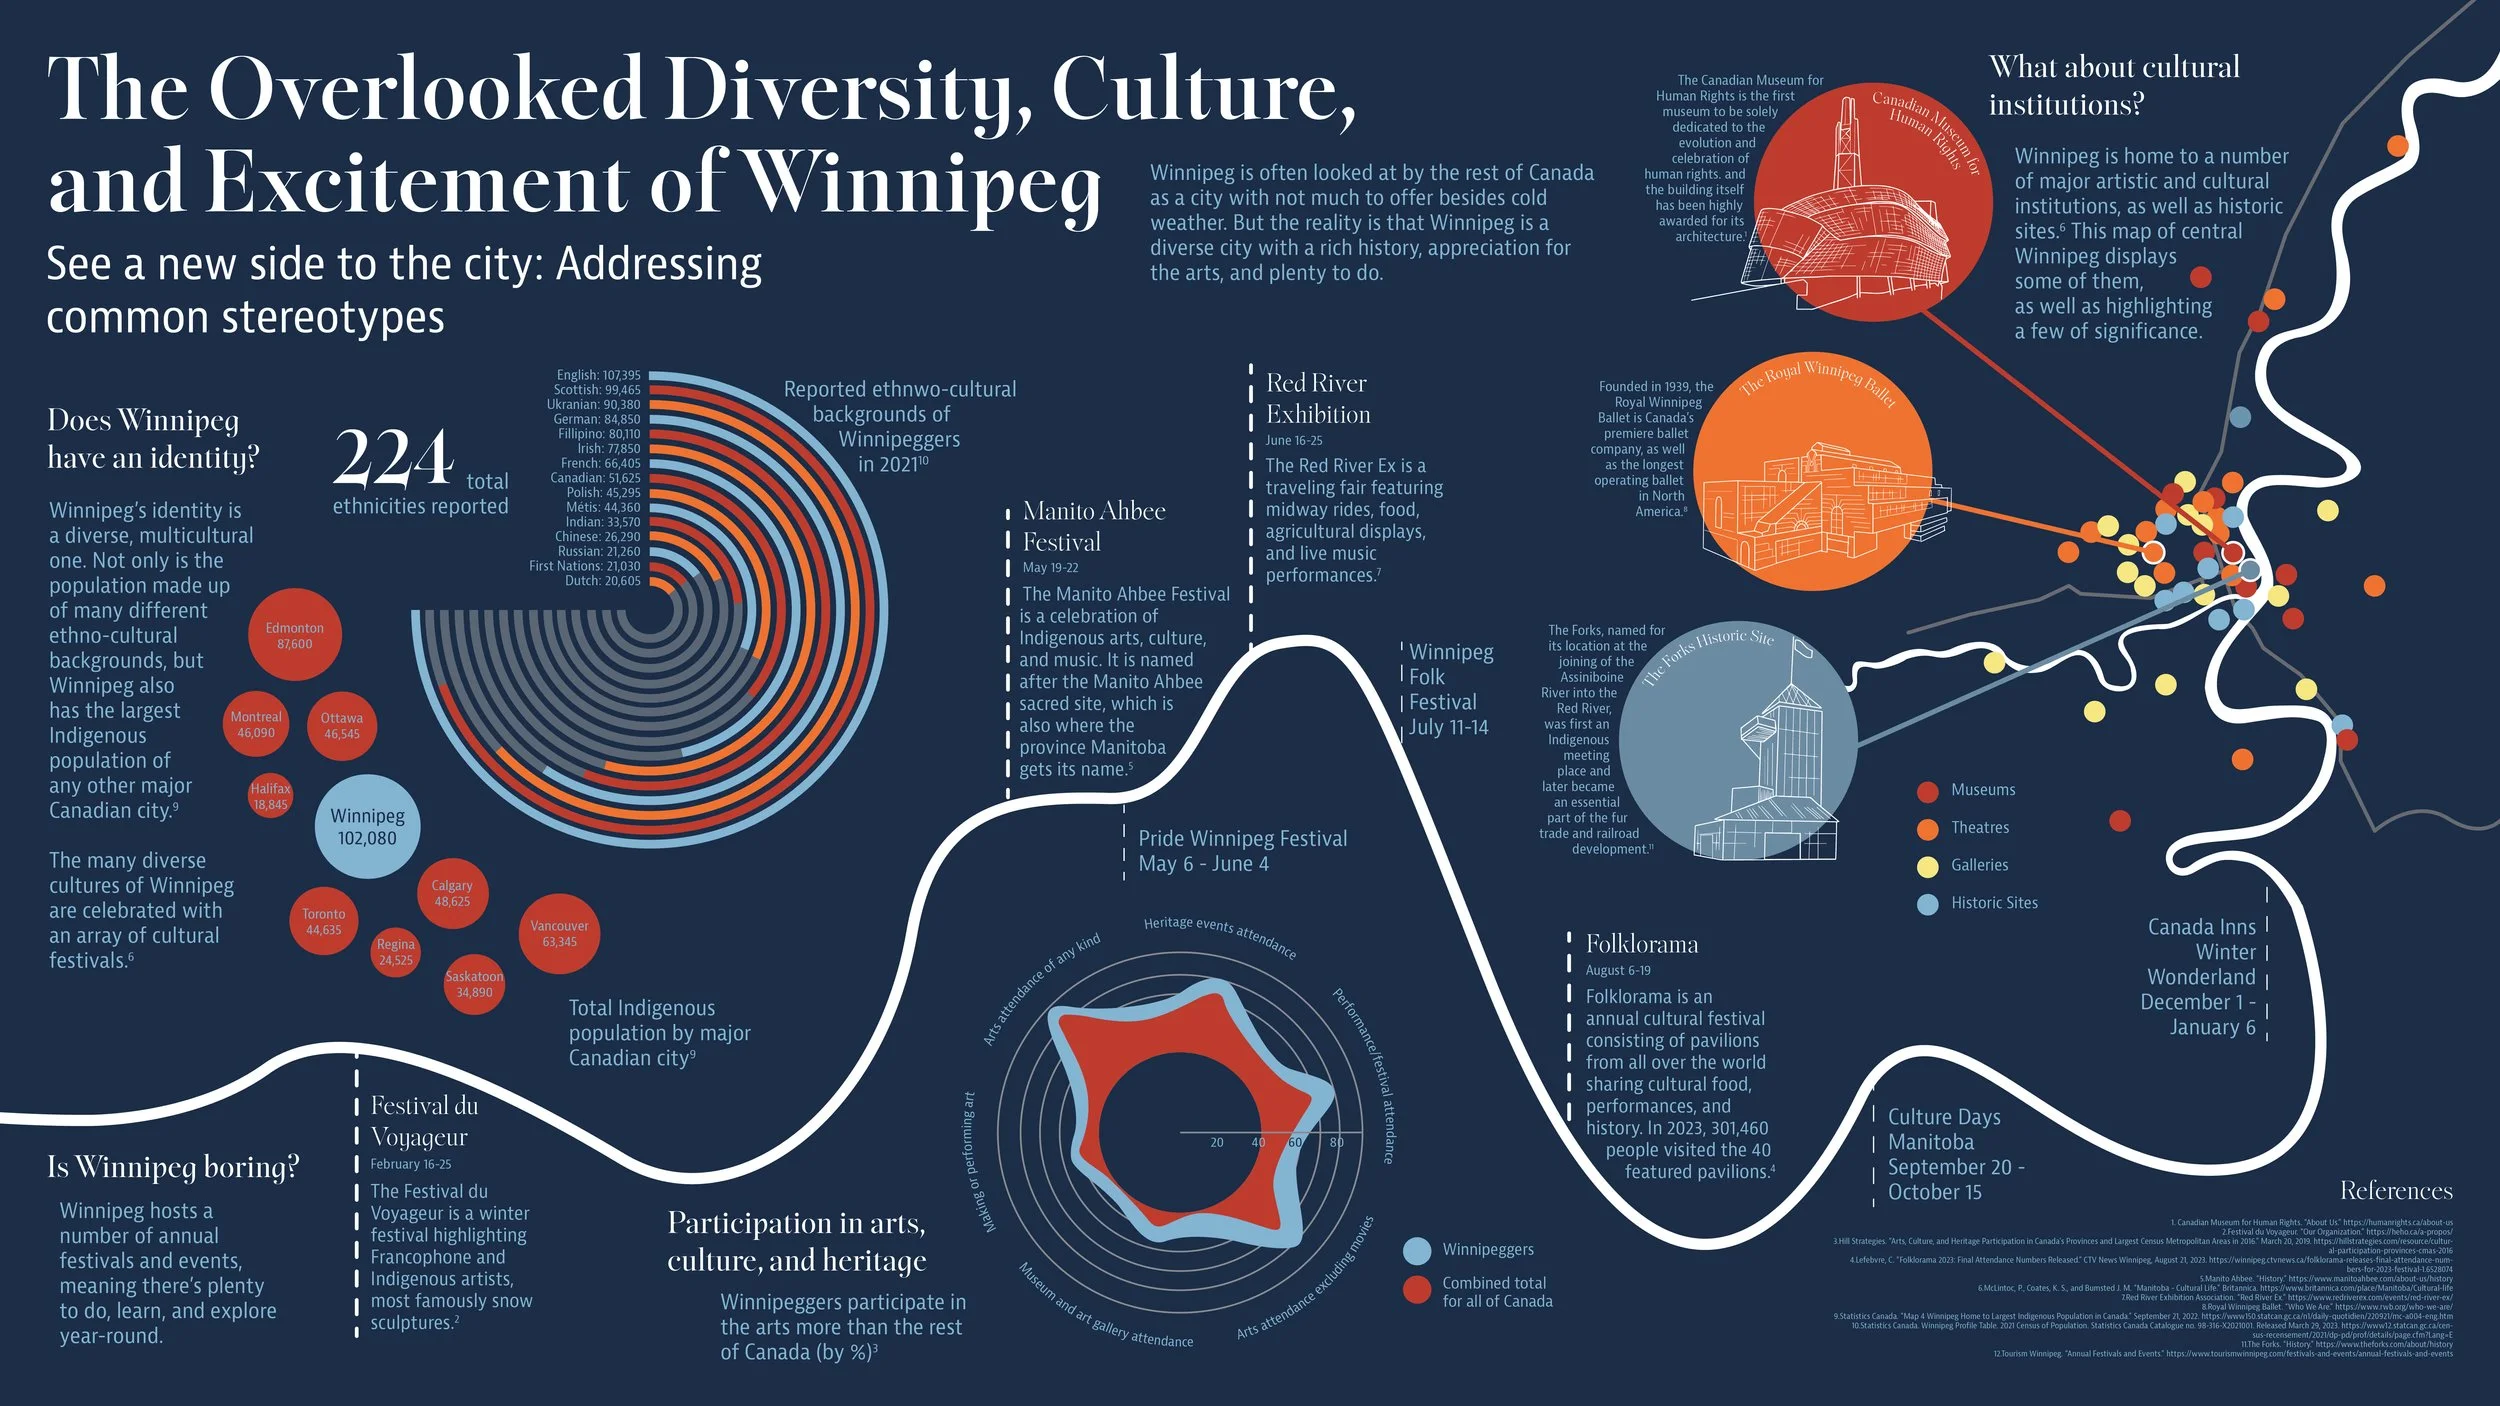
4. Final product. Finalized timeline graphic and overall poster layout. Added all text, labels, and references.