Systems Mapping: Alberta Emergency Medicine
Goal: Create clarity within the complex issue of Alberta’s emergency medicine crisis by visualizing the systems surrounding the issue. Conduct research and develop a series of systems maps to visualize the actors, relationships, and factors that make up these systems.
Tools
Illustrator, InDesign
Year
2024
Course
Systems Thinking & Changemaking


In this project we were tasked with identifying a complex challenge, or “wicked problem” in the world, and understanding, mapping, and visualizing it. Continuing from the style guide and asset development project I had completed the previous year, I chose to expand my research into the emergency medicine crisis in Alberta. This project consisted of three parts: A research dossier including literature review, subject matter expert interviews, and field research; a set of systems maps that visualize that research; and a presentation developed to showcase the maps and research.
Design Process
Research Dossier
The first component of the research dossier was a literature review. Continuing off of the research I had conducted for the previous year’s project, I collected 15 academic sources on the subject of strain on emergency medicine systems and it’s causes and effects. This included topics such as emergency department overcrowding, access to primary care, and labour shortage.

Systems Maps
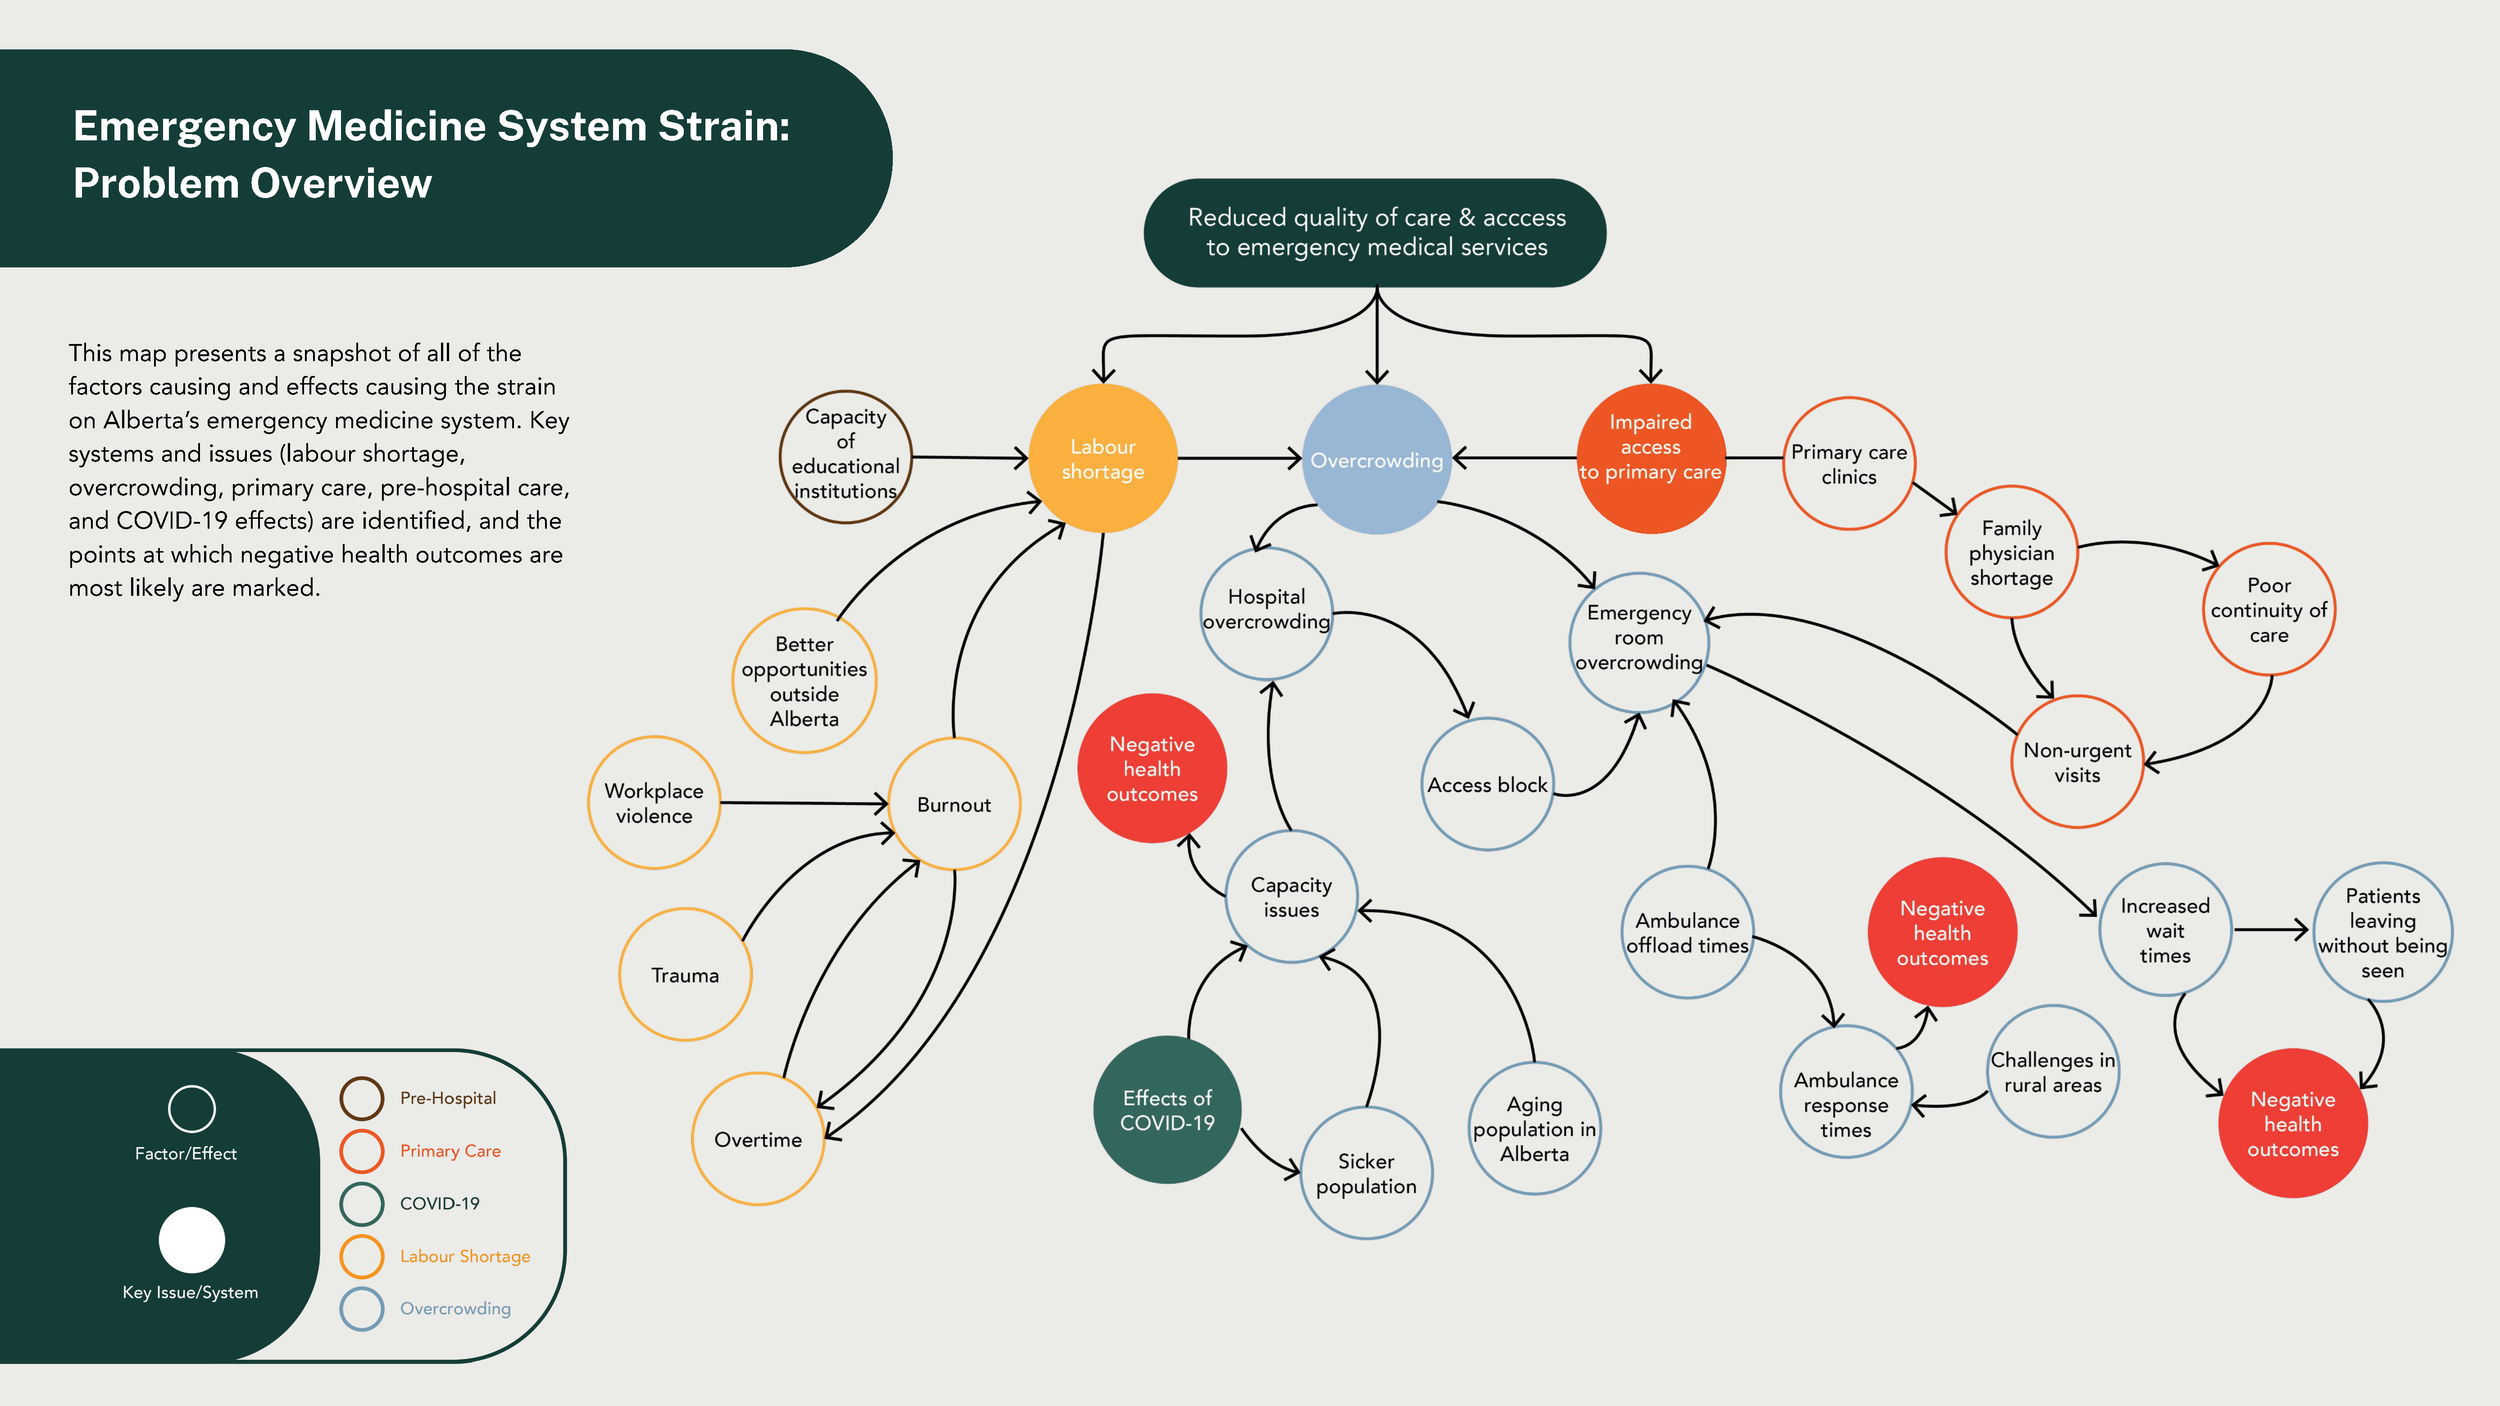
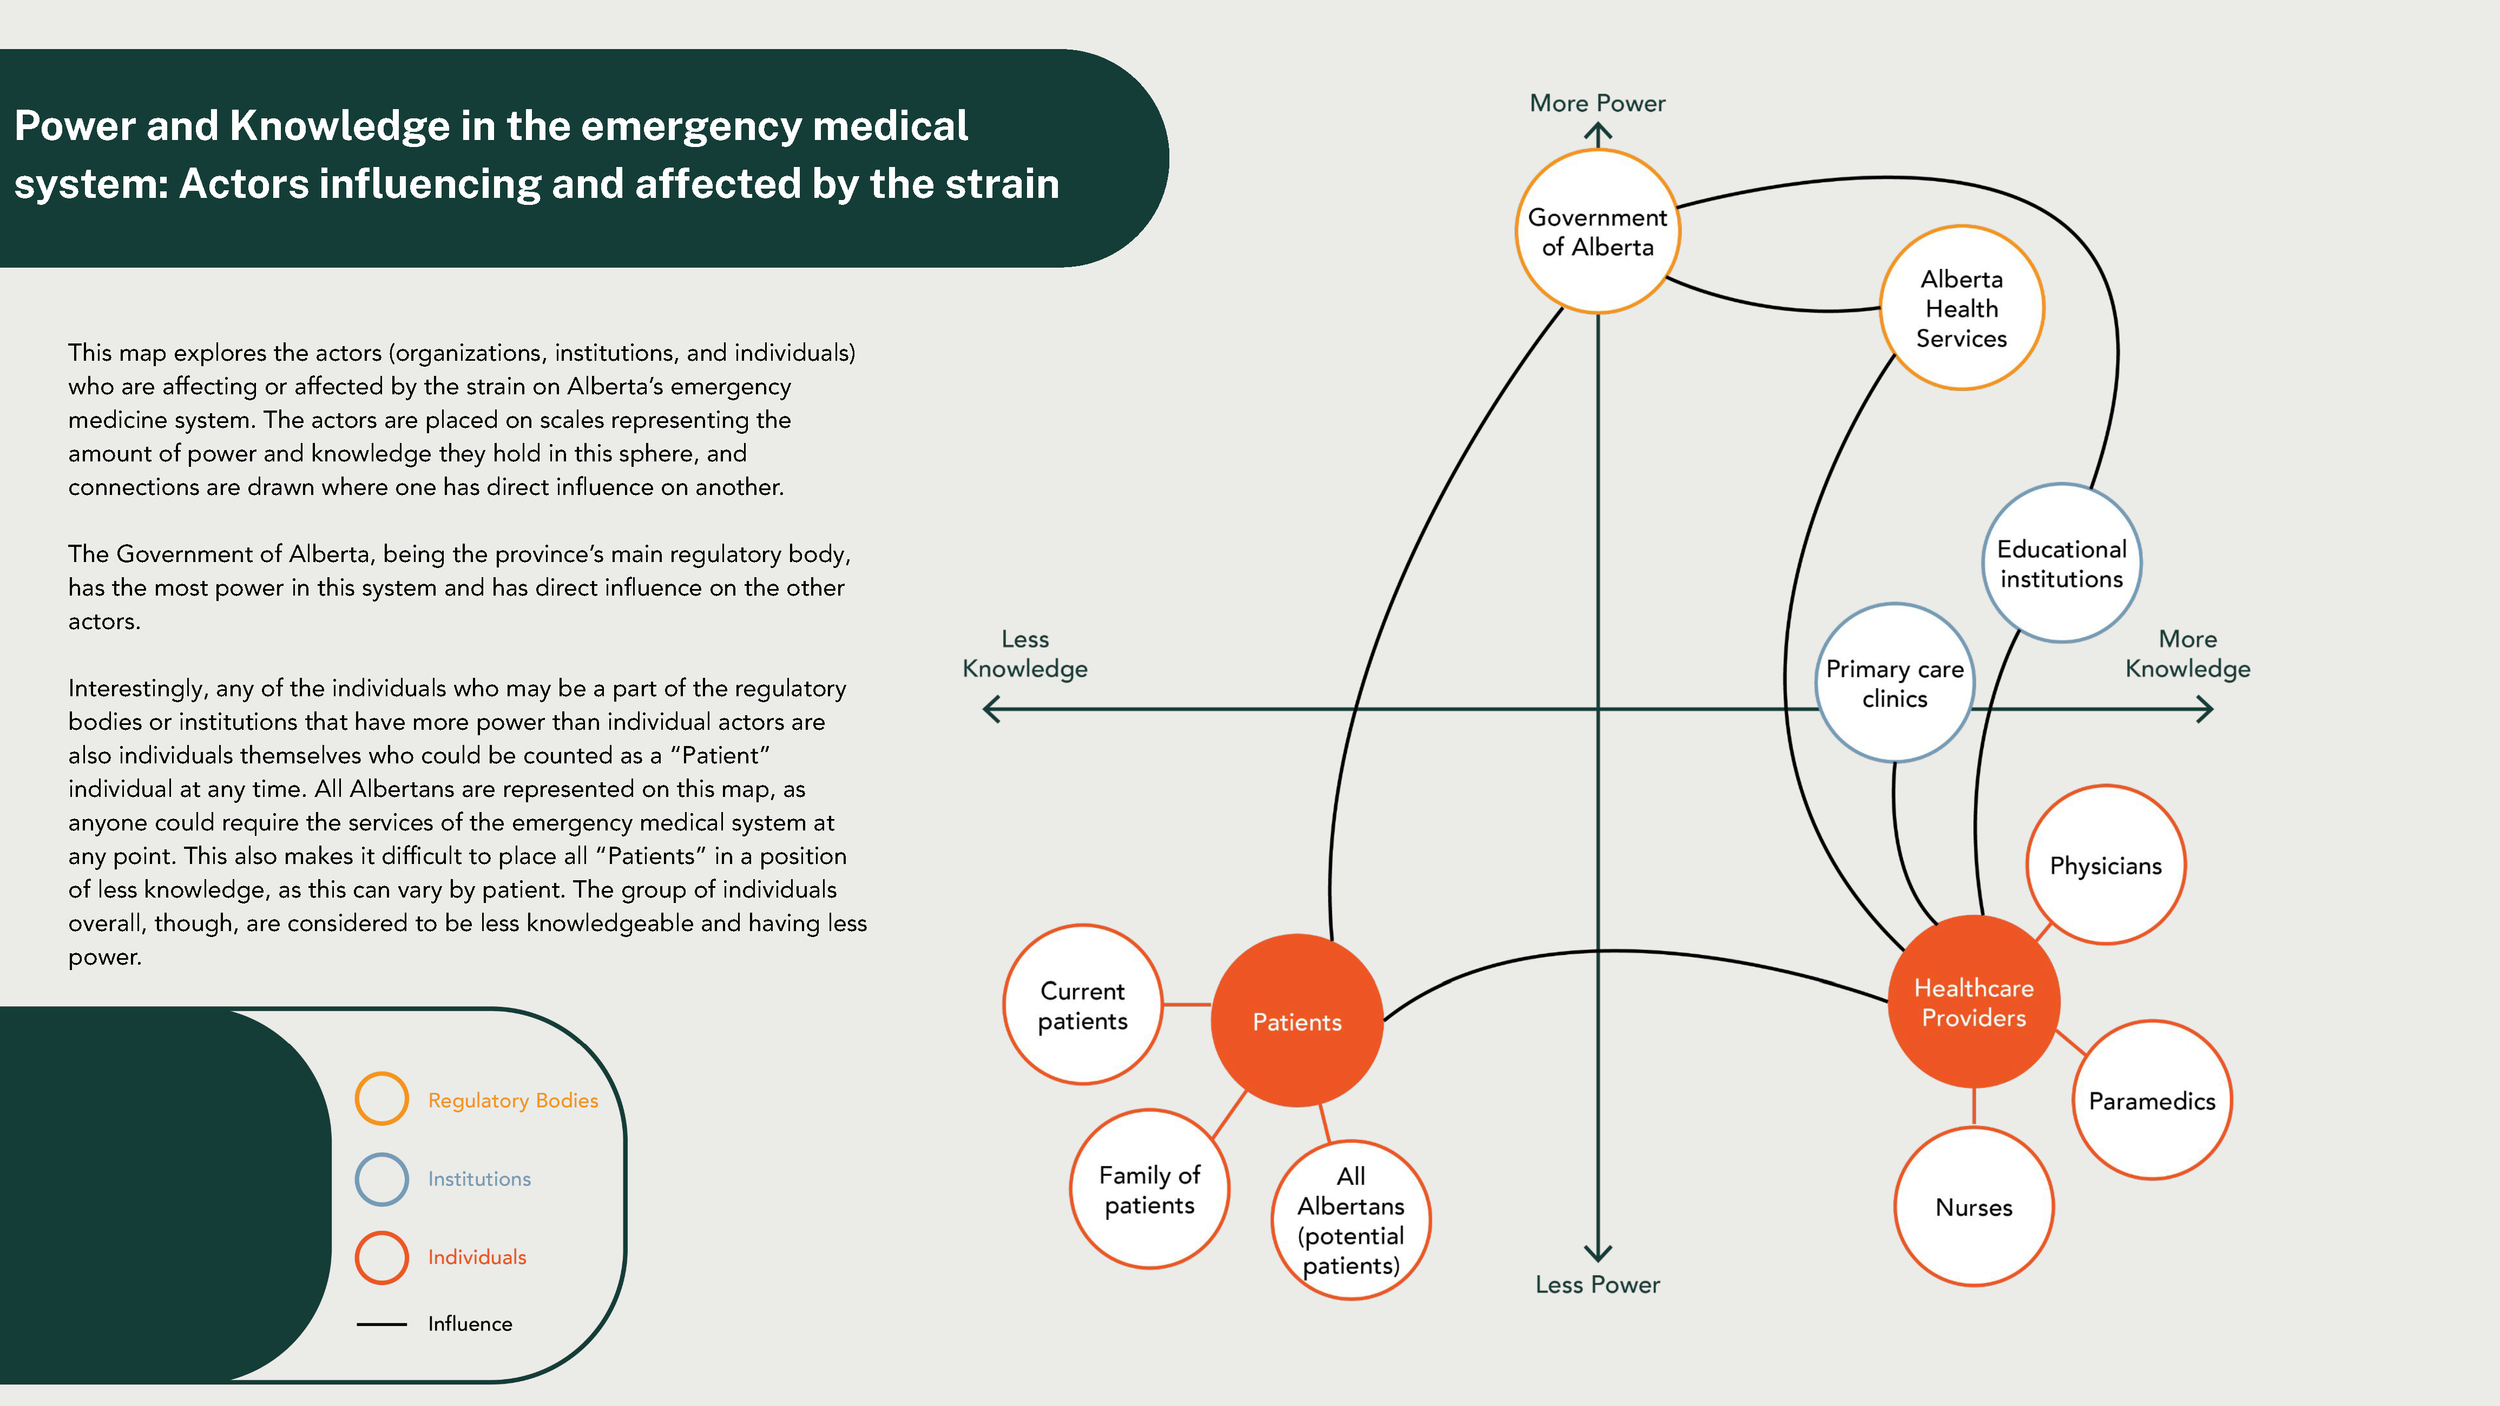
After my research was completed, I began to organize the key factors and insights I had identified into a simple systems map. The goal was to eventually include all identified causes and effects of strain on Alberta’s emergency medicine system, and visually demonstrate how they are connected and impact each other.
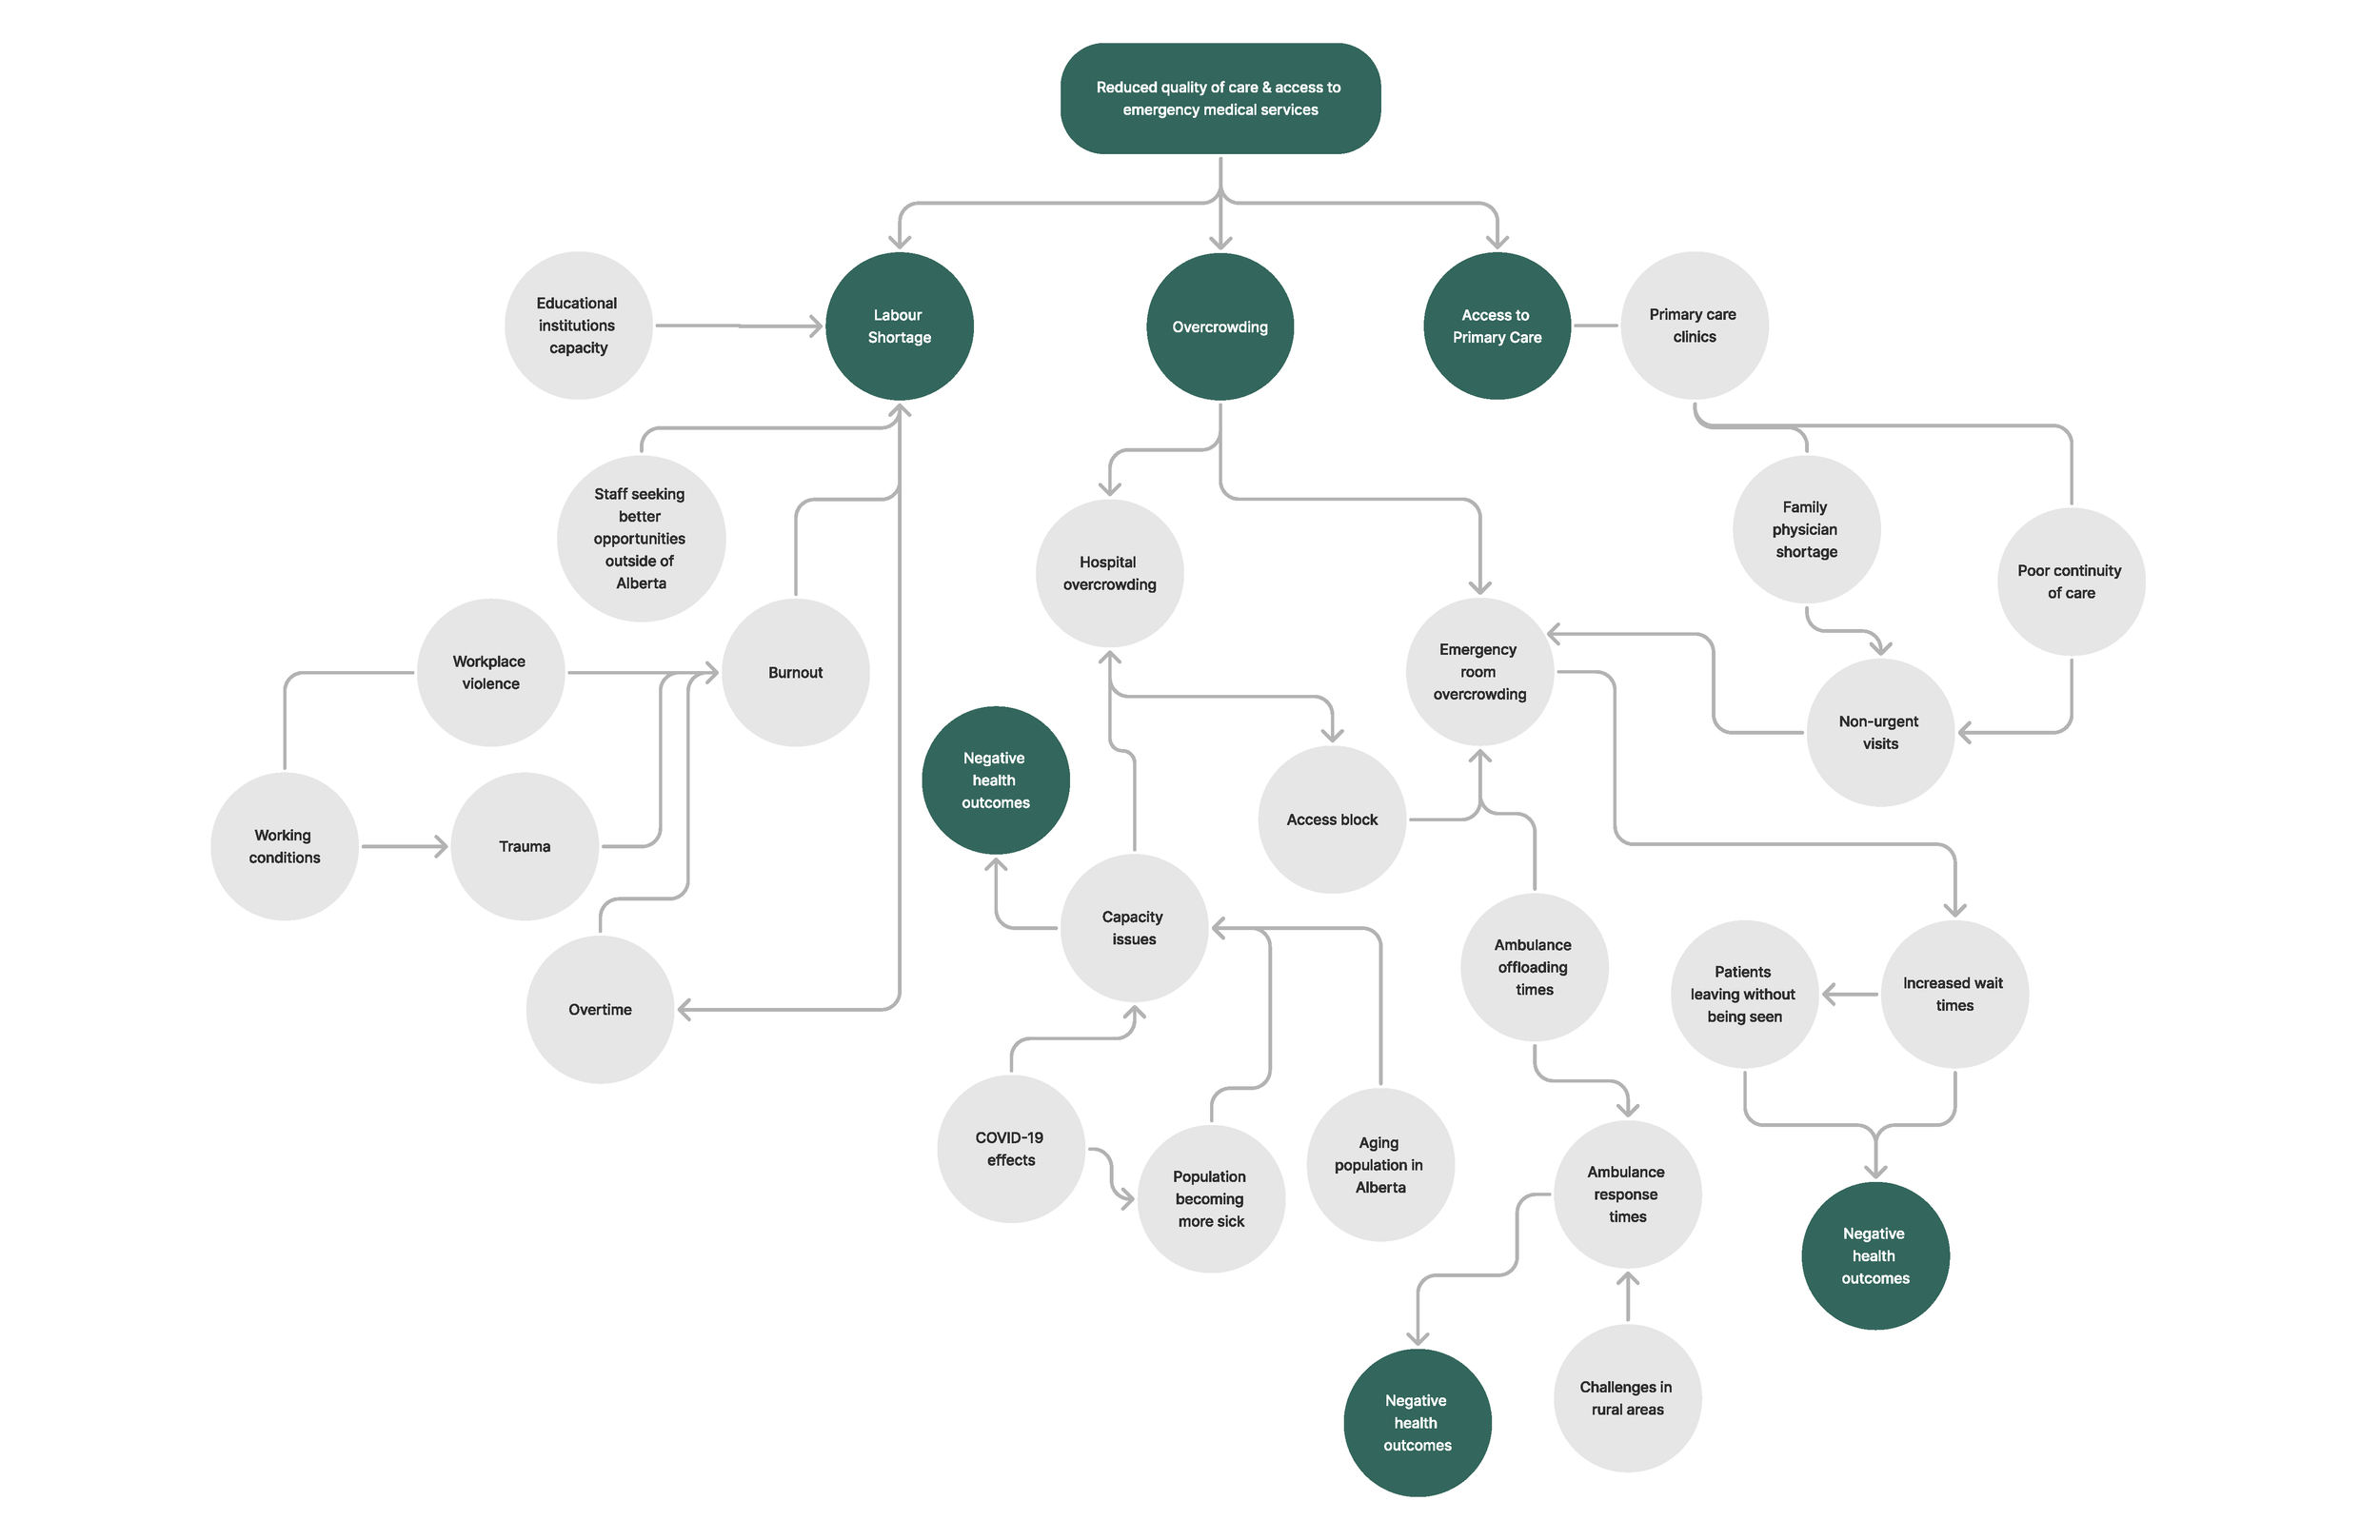
Initial, surface level systems map showing main factors and a few connections

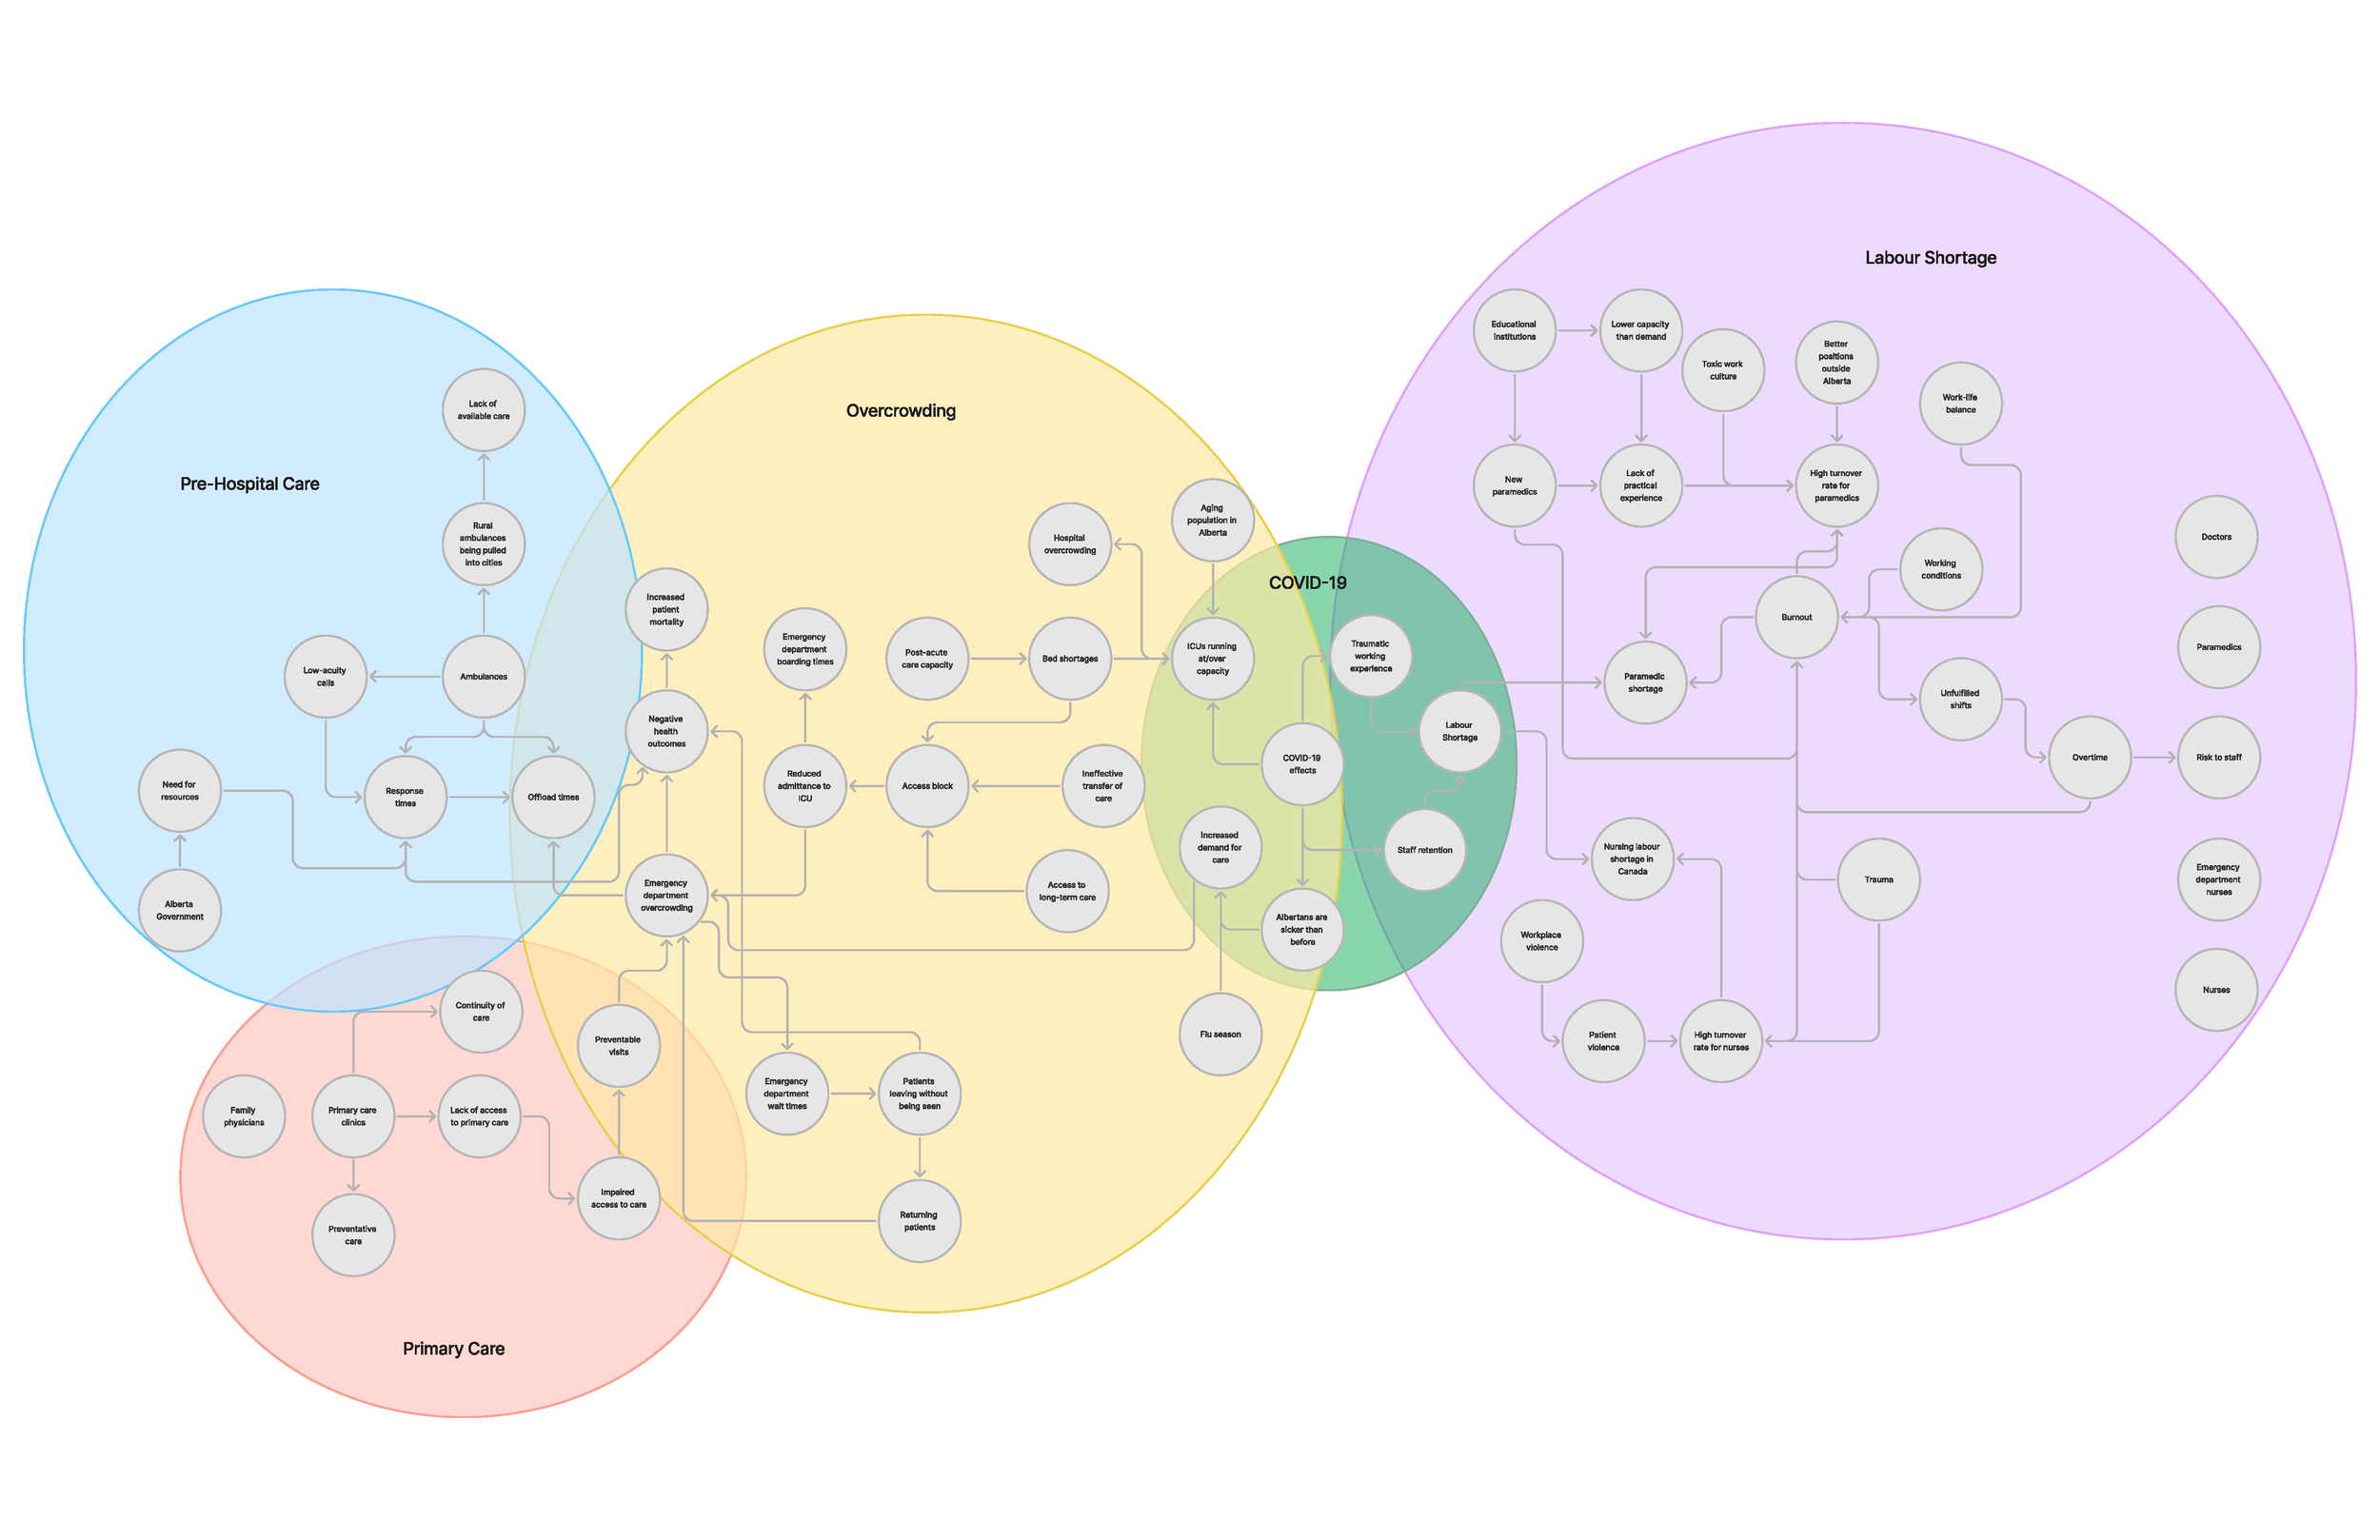
Second draft systems map. I have identified five main contributing factors, placed individual concepts and actors within them, and made most of the connections between them. Feedback loops have been identified.
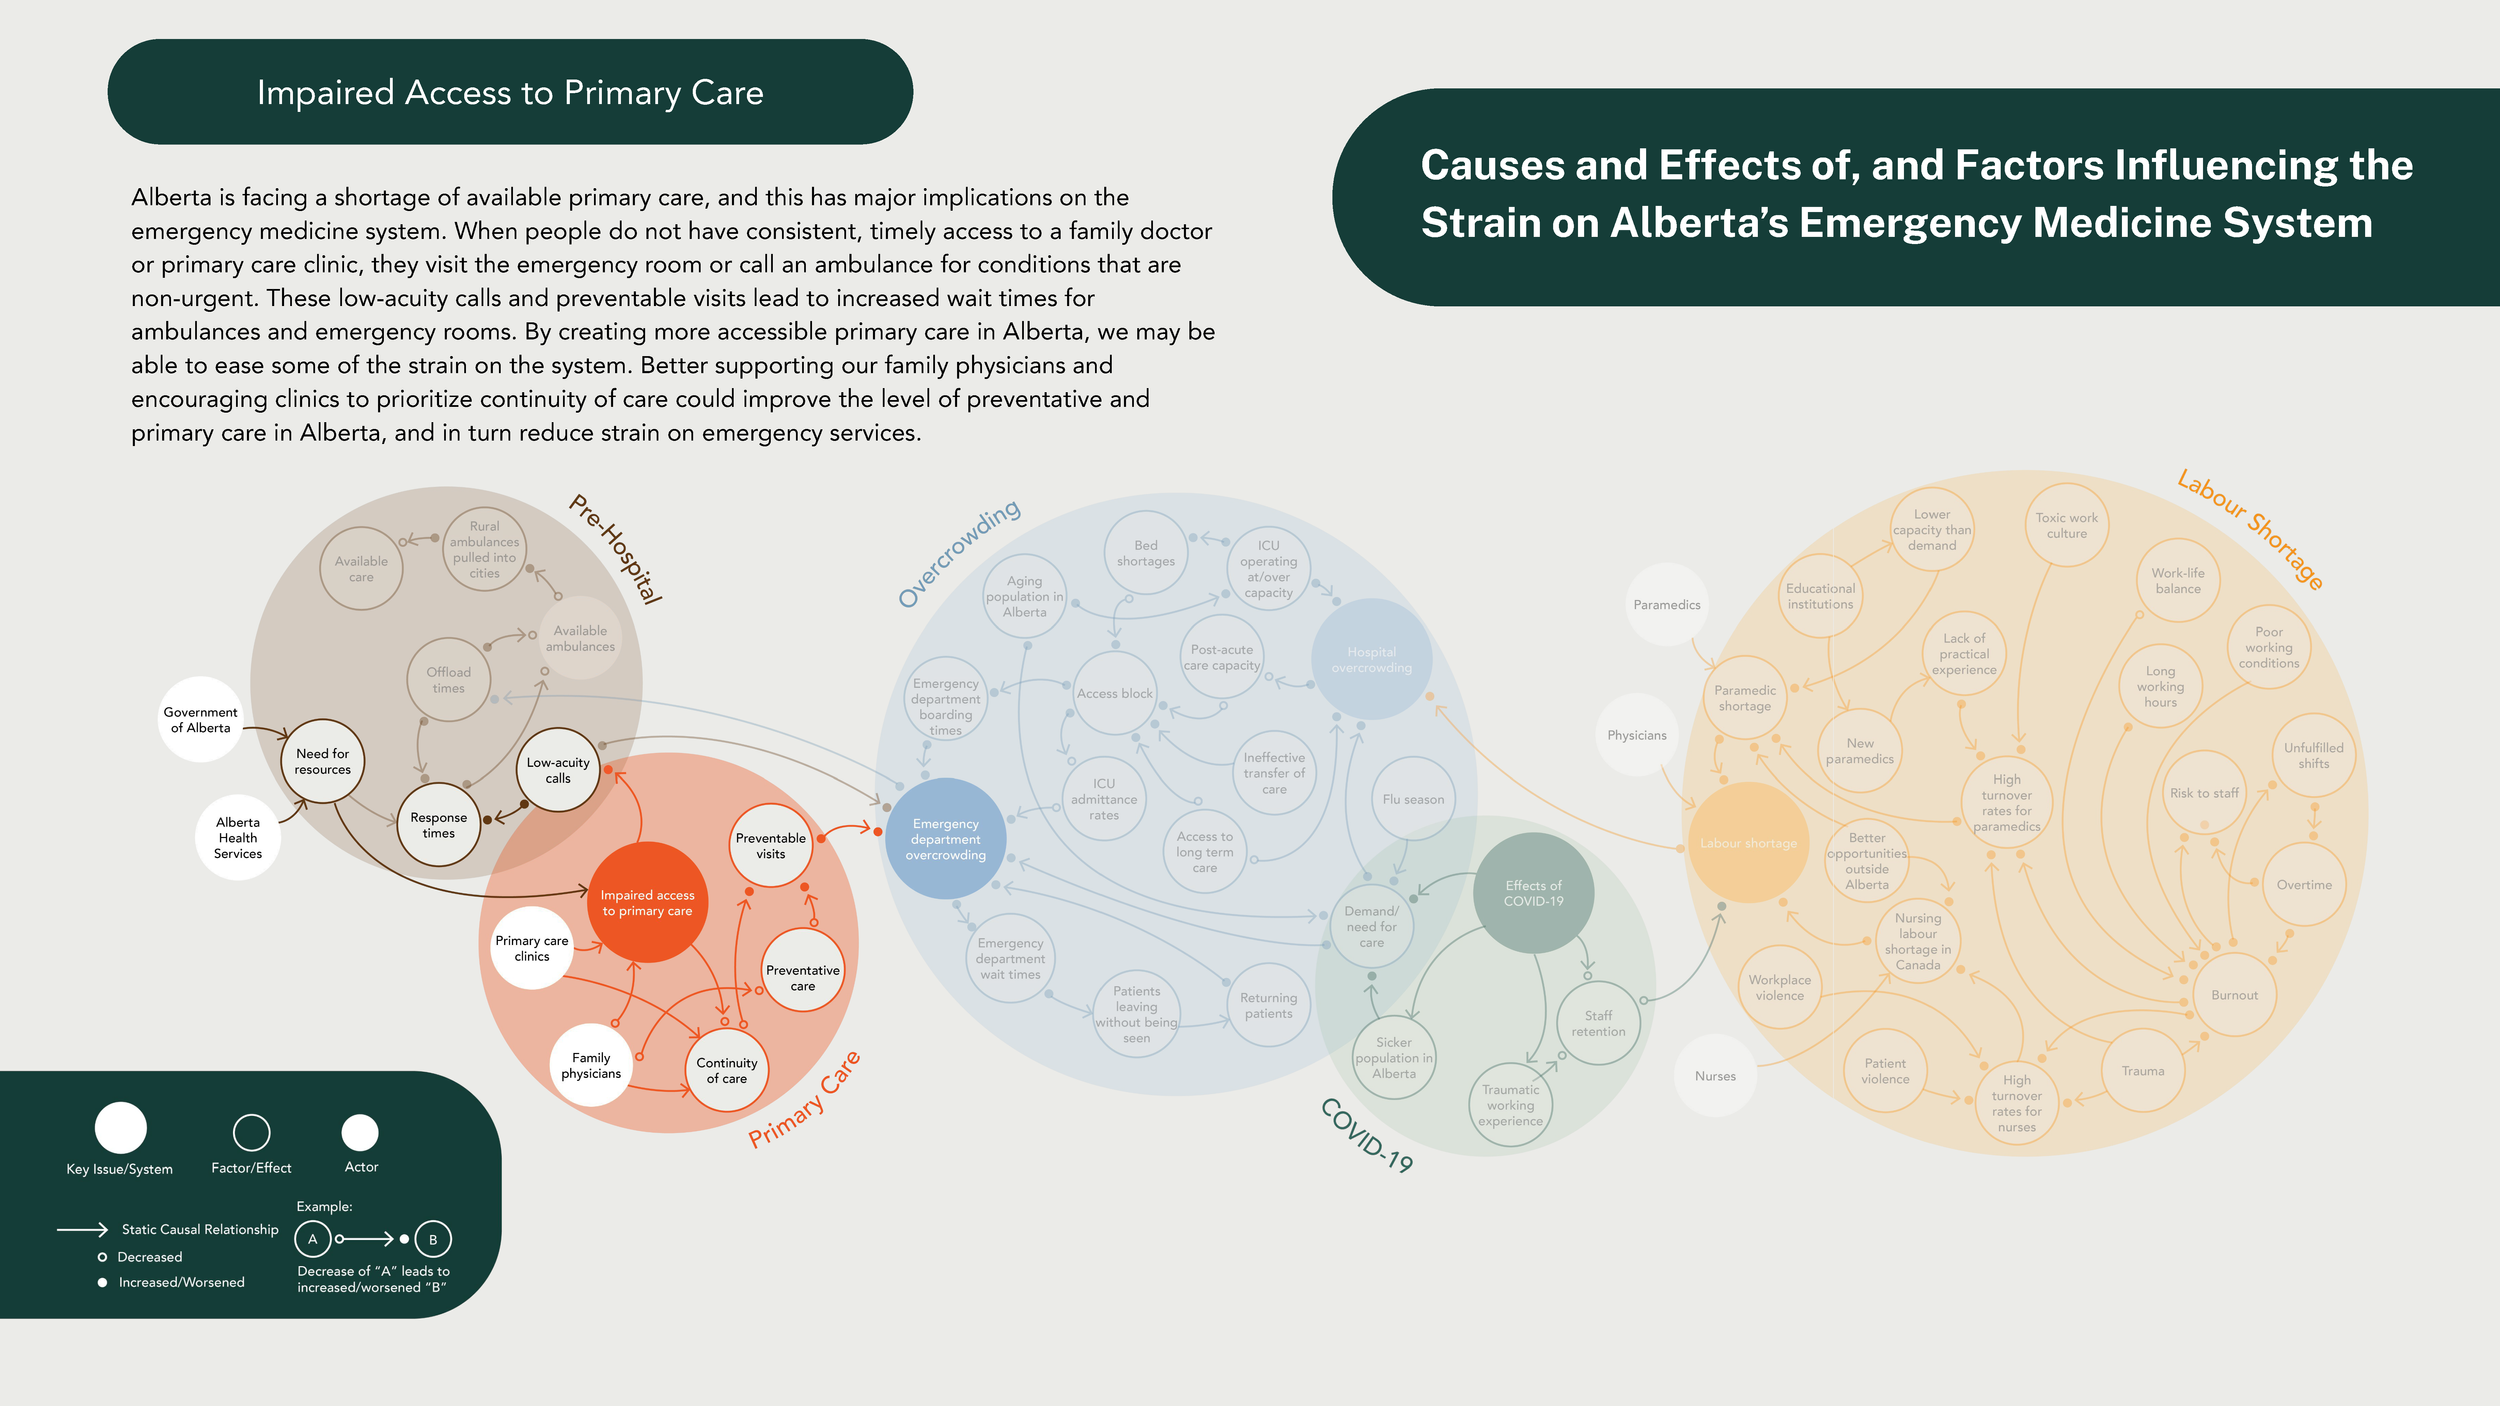
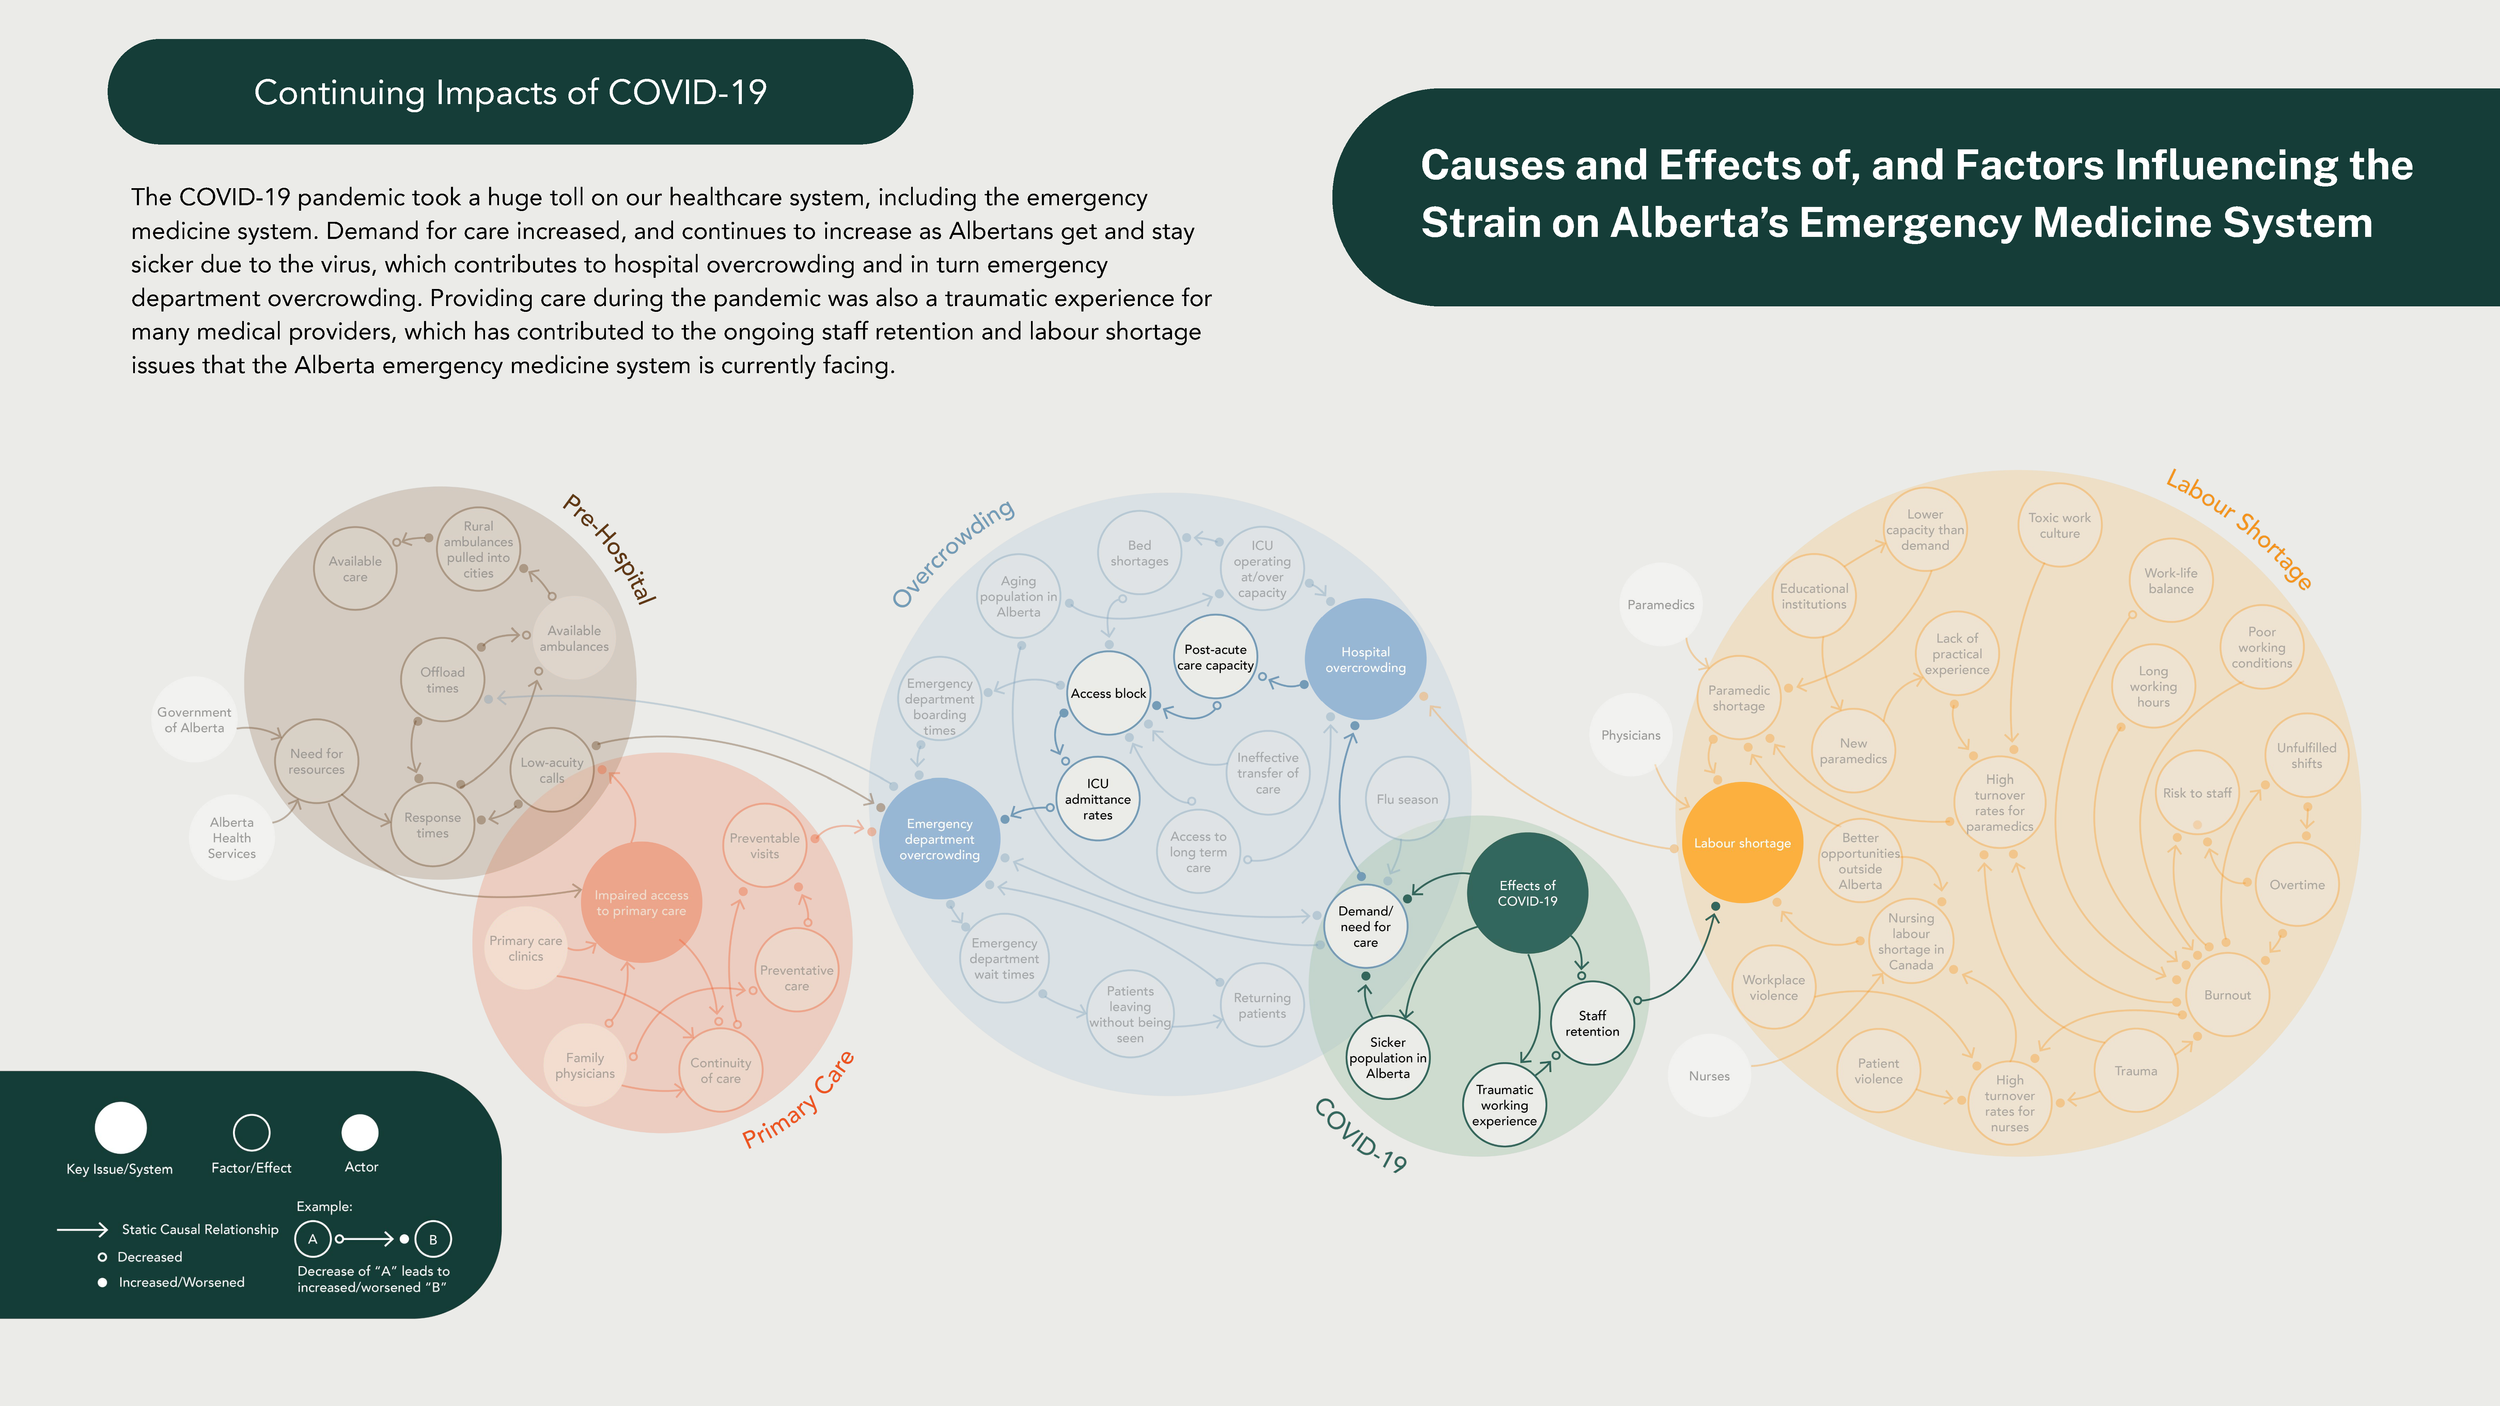
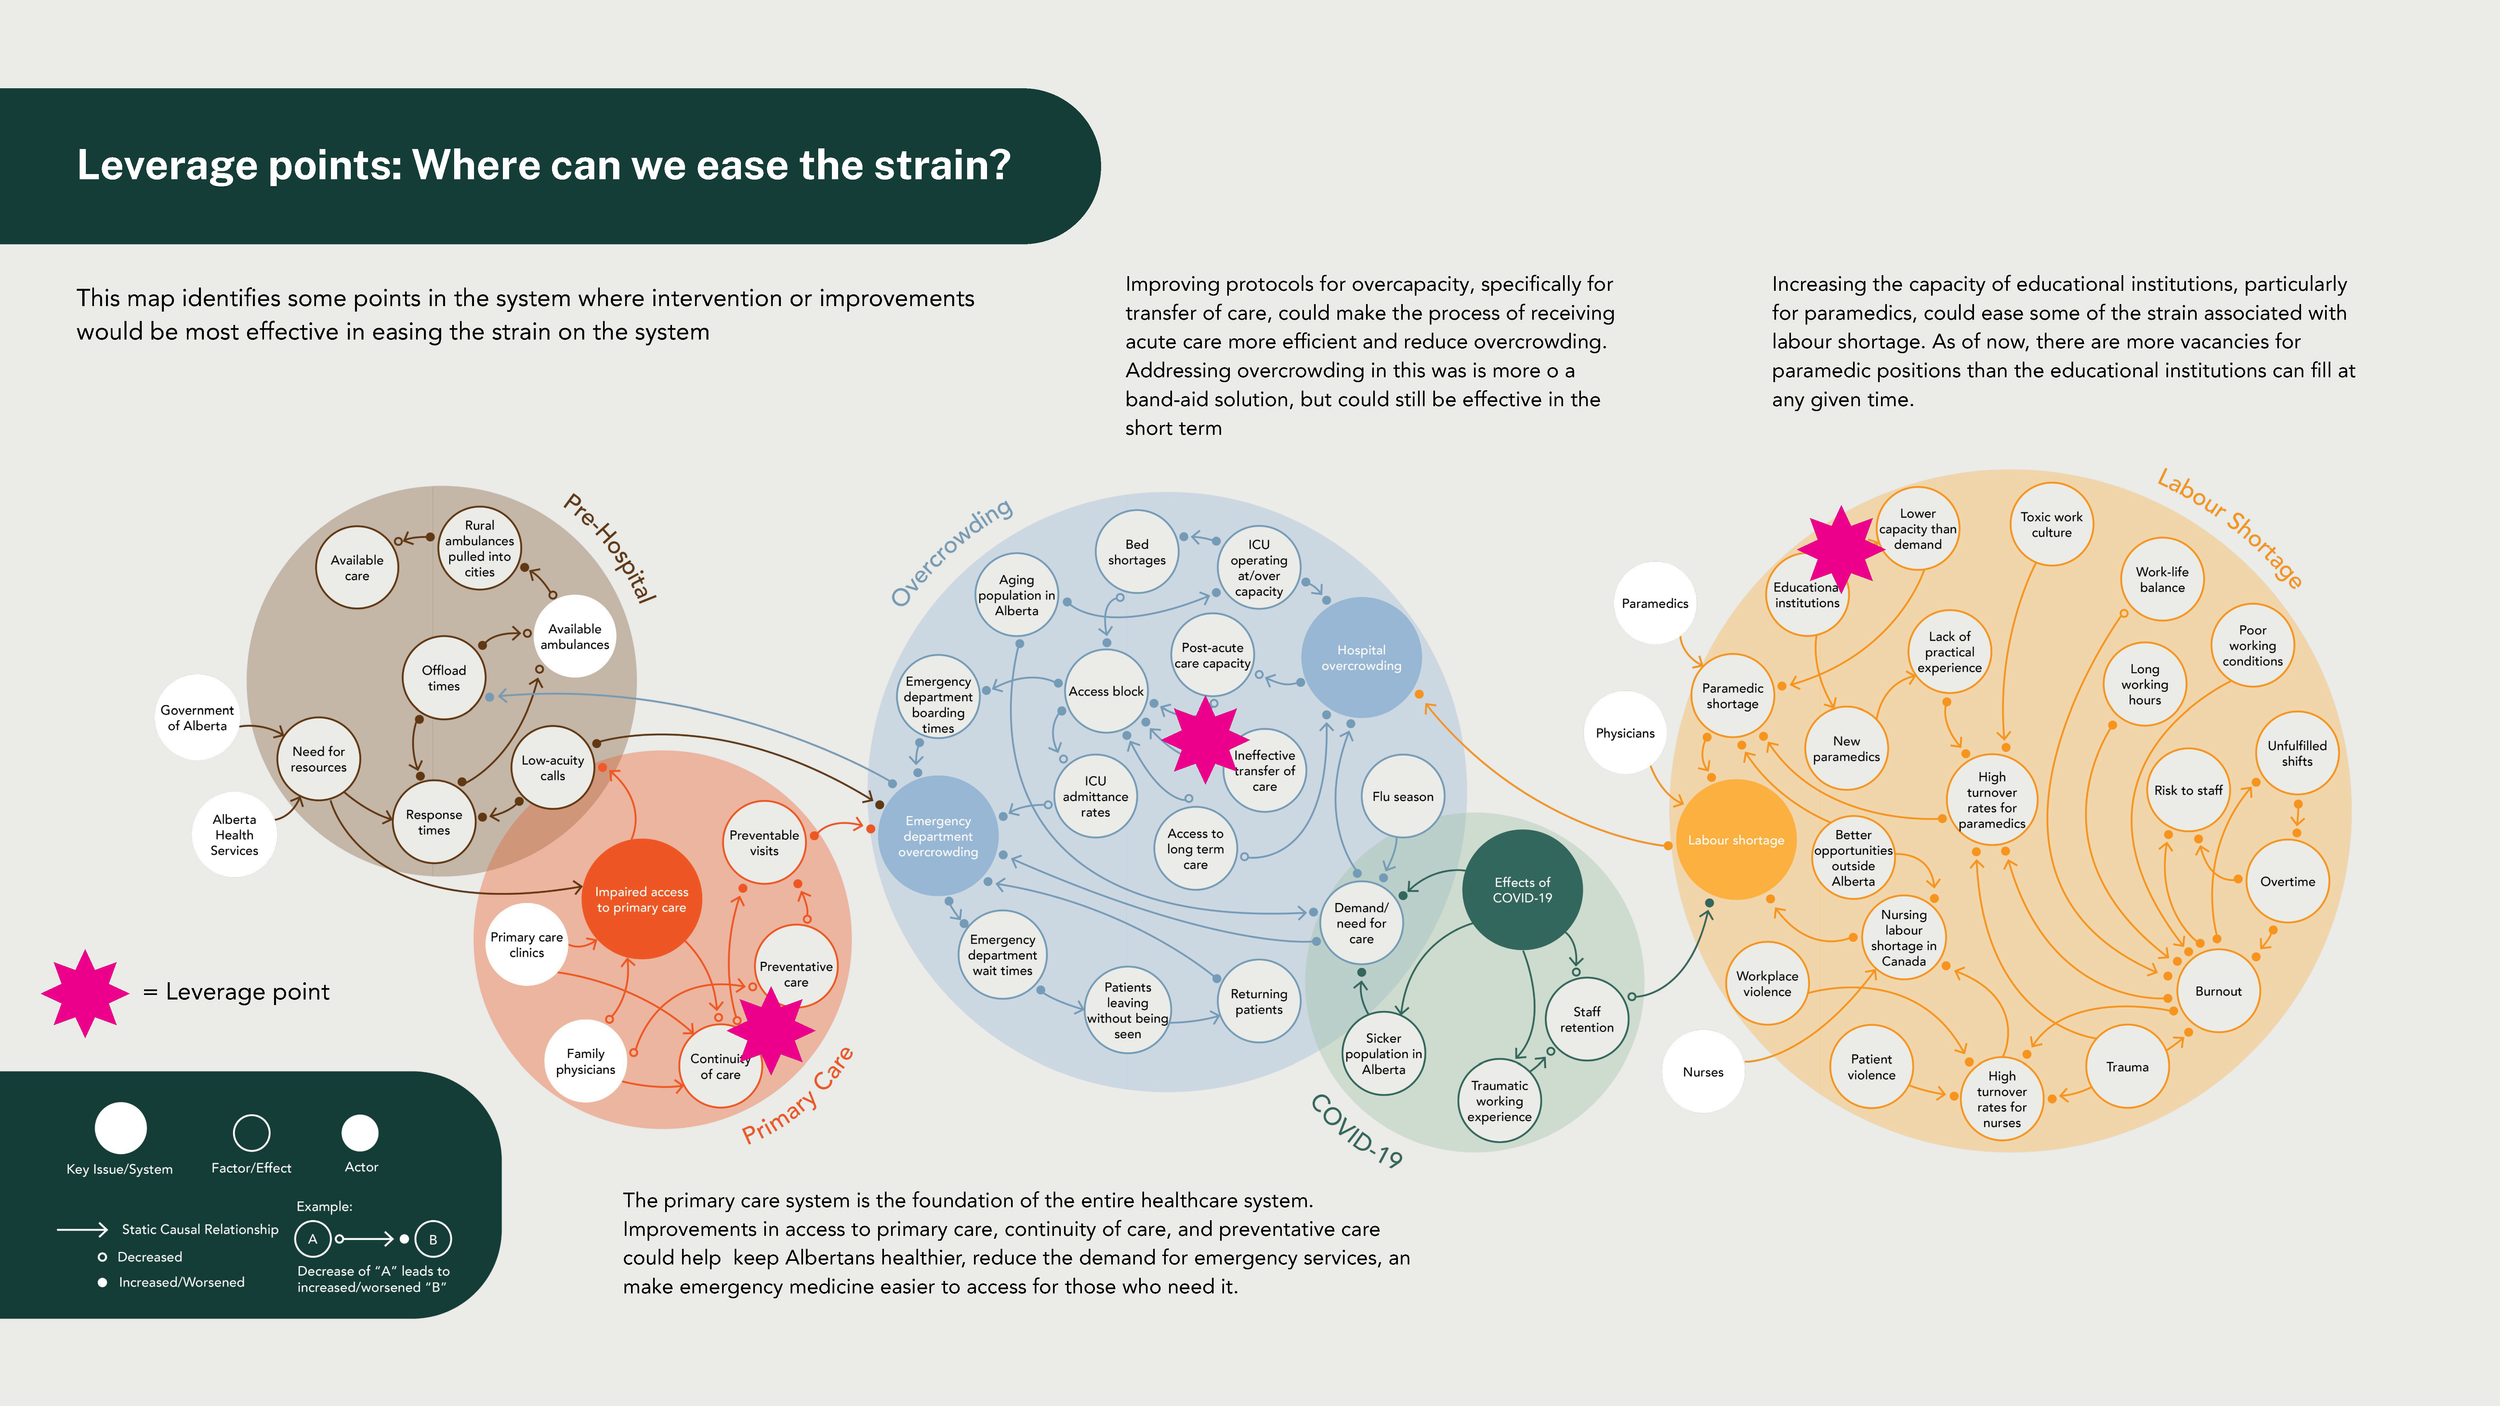
Using the final systems map, I also highlighted key overall insights by visually separating the factors that make them up from the rest of the map. For example, here I am using the map to discuss how access to primary care impacts both pre-hospital care and emergency department overcrowding.

In order to present our research, our systems maps were presented in MRU’s Immersion Studio space. We held a showcase in which every students’ maps were displayed alongside other students researching similar topics.
We developed presentations that would not only demonstrate our research and systems mapping projects, but also communicated common themes and interactions within the research done by the other members of our showcase groups.

I also conducted two subject matter expert interviews in order to get a better understanding of some of the topics I had researched, as well as to get personal insight into this issue from people who are directly impacted by it. This also helped me gain specific insight into the situation in Alberta. These interviews were visually encoded to highlight key insights and themes.
Additionally, I conducted field research in a local emergency department.
All of my research was compiled into a document that was designed using the style guide I developed in the previous year’s project. View my entire research dossier here!
Showcase
I read and summarized each of these sources, describing how they contributed to my understanding of the subject and how they related to each other. At the end of my literature review, I summarized the key insights that would guide the rest of my research and project.
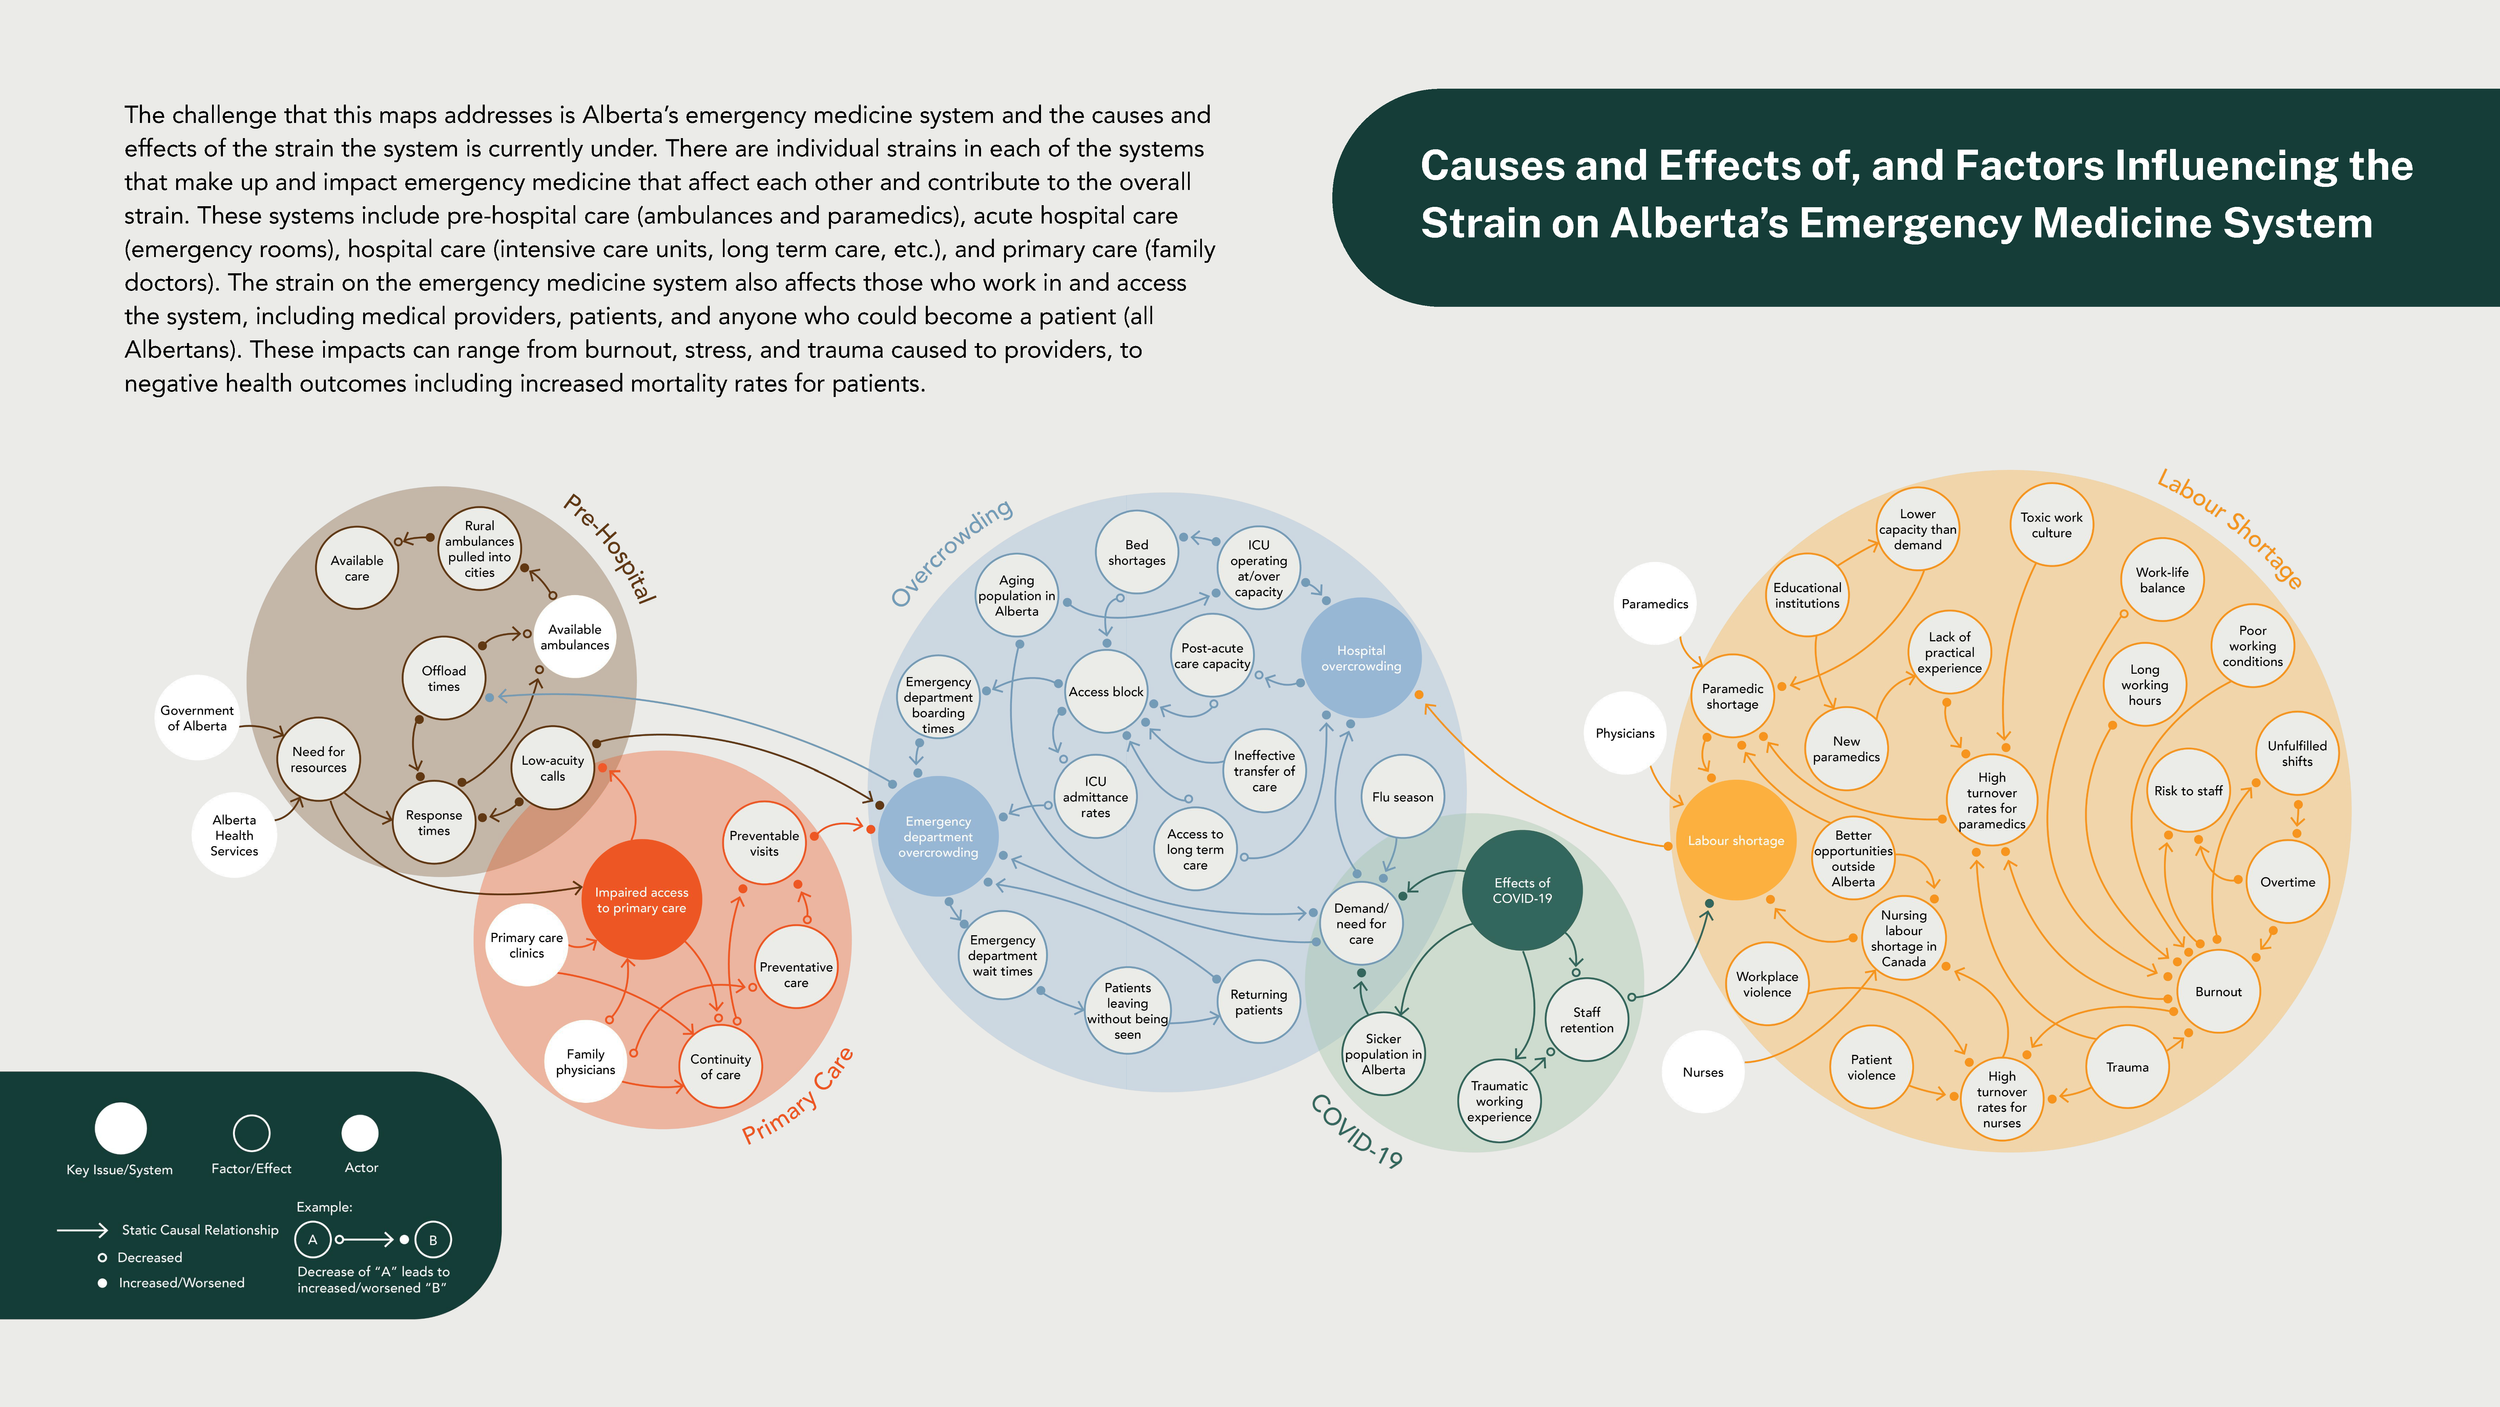
Final systems map.